This post assumes that the reader has created a new Git branch (and corresponding Platform.sh environment) or wishes to use an existing one to perform this work. Please see the documentation page for details on this process.
The first thing we need to do is make sure that the XHProf extension is enabled on our Platform.sh project. We do this by adding a key to the extensions list in our .platform.app.yaml file, like so:
runtime:
extensions:
- name: redis
- name: xhprof
This will enable the extension for us automatically. Now we add some lines to our deploy hooks to ensure that our tools are present. (We’ll be using the Platform application’s temp directory, and while this is persistent across deployments of the same environment, we want our code to be mergeable and keep the tools around. Let’s add this to the deploy hooks section of .platform.app.yaml :
hooks:
deploy: |
cd /app/tmp
[ -d xhprof ] || mkdir xhprof
[ -d fg ] || git clone https://github.com/brendangregg/FlameGraph.git fg
[ -d xhpfg ] || git clone https://github.com/msonnabaum/xhprof-flamegraphs.git xhpfg
Next, we need to tell our codebase to actually use XHProf during page requests. We’ll do this by adding some code to the front of Drupal’s index.php file. There are two ways of doing this: In vanilla mode (i.e. with the entire Drupal site committed to the Git repository) we simply edit the index.php file. If we’re using project mode, we add the below patch to our repository and add a line to our project.make file to allow us to patch Drupal during the build process.
This is the patch for index.php :
diff --git a/index.php b/index.php
index 8b83199..021ba09 100644
--- a/index.php
+++ b/index.php
@@ -11,6 +11,15 @@
* See COPYRIGHT.txt and LICENSE.txt.
*/
+// Enable XHProf profile collection:
+xhprof_sample_enable();
+register_shutdown_function(function () {
+  $url_parts = implode("_", arg());
+  $filename = '/app/tmp/xhprof/' . $url_parts . '.' . uniqid() . '.sample_xhprof';
+  file_put_contents($filename, serialize(xhprof_sample_disable()));
+  chmod($filename, 0777);
+});
+
/**
* Root directory of Drupal installation.
*/
And we add this line to our makefile in project mode:
projects[drupal][patch][] = "patches/drupal-enable-profiling.patch"
With this additional code committed, we’re ready to push to Platform.sh and have our new environment built. Once that’s done, now the fun begins! We need to SSH to our Platform.sh environment (using the CLI this is achieved with platform ssh ) and we’ll end up in our home directory, which is /app . Our codebase lives in /app/public , but we set up our deploy hooks to use the application’s temporary directory for our tools and results. Our temp directory should look something like this:
web@ns6k2cp43m25z-xhprof-test--php:~$ cd /app/tmp
web@ns6k2cp43m25z-xhprof-test--php:~/tmp$ ls -lha
total 24K
drwxr-xr-x 7 web web 4.0K Jul 29 14:15 .
drwxr-xr-x 8 web web  139 Jul 28 16:39 ..
-r--r--r-- 1 web web  491 Jun 14 02:04 .htaccess
drwxr-xr-x 6 web web 4.0K Jul 28 15:33 fg
drwxr-xr-x 2 web web 4.0K Jul 28 17:49 xhprof
drwxr-xr-x 3 web web 4.0K Jul 28 15:33 xhpfg
This sets up the directory our profiling patch is expecting to store files in, and grabs the tools we’ll need to turn those profiles into a flamegraph. Now it’s time to test! Using the Platform.sh environment’s URL, we load whatever page we’re interested in profiling. (Usually its a good idea to load this page several times so that we can collect a decent set of statistics to build our flamegraph on.) Once we’ve done that, we’ll have a pile of profile result files in our /app/tmp/xhprof directory, like so:
web@ns6k2cp43m25z-xhprof-test--php:~$ ls -lha tmp/xhprof/
total 284K
drwxr-xr-x 2 web web 4.0K Jul 28 16:45 .
drwxr-xr-x 7 web web 4.0K Jul 28 15:49 ..
-rwxrwxrwx 1 web web  12K Jul 28 16:44 node.55b7b17f3c9fb.sample_xhprof
-rwxrwxrwx 1 web web  23K Jul 28 16:45 node.55b7b19d948cd.sample_xhprof
-rwxrwxrwx 1 web web  16K Jul 28 16:45 node.55b7b1a690f65.sample_xhprof
-rwxrwxrwx 1 web web  96K Jul 28 16:44 user_1_orders.55b7b16f39561.sample_xhprof
-rwxrwxrwx 1 web web  56K Jul 28 16:44 user_1_orders.55b7b17cb2462.sample_xhprof
-rwxrwxrwx 1 web web  25K Jul 28 16:45 user_1_orders.55b7b1996f888.sample_xhprof
-rwxrwxrwx 1 web web  30K Jul 28 16:45 user_1_orders.55b7b1a351e10.sample_xhprof
Notice that our patch names the result files based on the requested path, which makes it easy to grab just the ones we need. In this case, we’re interested in the performance of a user’s order page, and so we’ll use those results. We create a separate folder for the results and move only those files into it:
cd /app/tmp
mkdir xhprof_user_1_orders
mv xhprof/user_1_orders.* xhprof_user_1_orders/
Now we should have just those results files available in our second folder. To create a flamegraph, we use the flamegraph tools (the Perl locale errors can be safely ignored) which we downloaded using a deploy hook:
/app/tmp/xhpfg/xhprof-sample-to-flamegraph-stacks /app/tmp/xhprof_user_1_orders \
| /app/tmp/fg/flamegraph.pl > /app/tmp/flamegraph.user_1_orders.svg
cp /app/tmp/flamegraph.user_1_orders.svg /app/public/sites/default/files/flamegraph.user_1_orders.svg
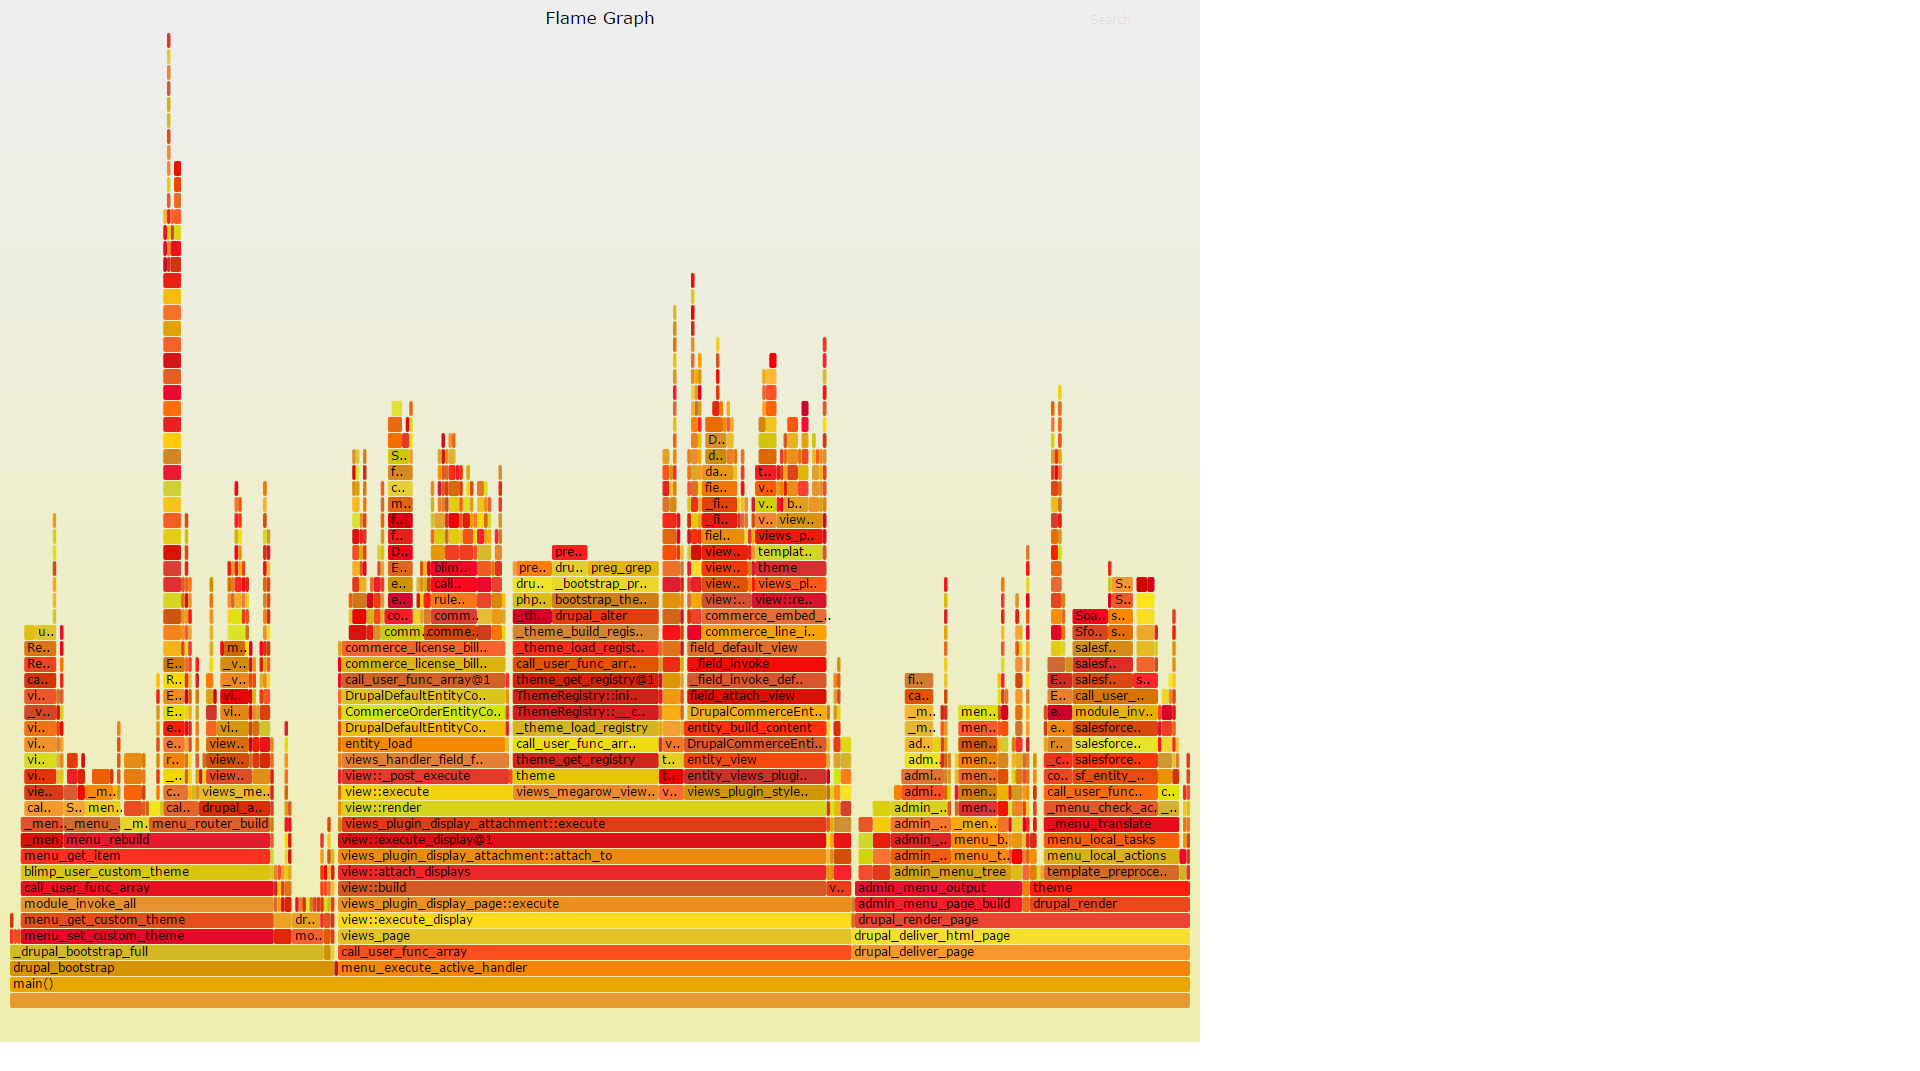
Ta-da! Now our SVG is viewable in our Drupal files directory from our Platform.sh environment. We can load it up in a web browser and examine performance, using the flamegraph to identify functions which are consuming more time during the page request than we expect. An example:
This lets us easily identify pieces of our code which need attention or contain performance-impacting bugs – we can browse the various components of the graph and peer into the children of each function call, looking for problem areas that need developer attention. (The colors are only used for contrast and don’t mean anything.) The Platform.sh team recently used this method to identify some problem code and wound up achieving a performance boost of roughly 1,200% on our order refresh actions. This is definitely a tool that is worth the effort to set up and use.
