I had several episodes in my .net development career, when I wanted to debug foreign code. The code, I have no sources access to, DLL only. Visual Studio has ability to debug code without sources.
This article is based on StackOverflow question where I tried to explain Unity behavior.
My solution uses Resharper features.
Ok, let’s start from a piece of code:
var cage2 = container.Resolve<ICage>("cage2");
I want to debug method Resolve of container. If you have access to source codes, you can go to method implementation and create new breakpoint:

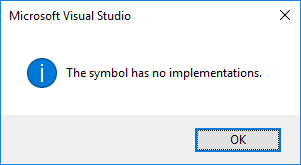
But default Visual Studio behavior cannot find implementation:
Step 1
Go to Resharper settings and change external sources behavior:
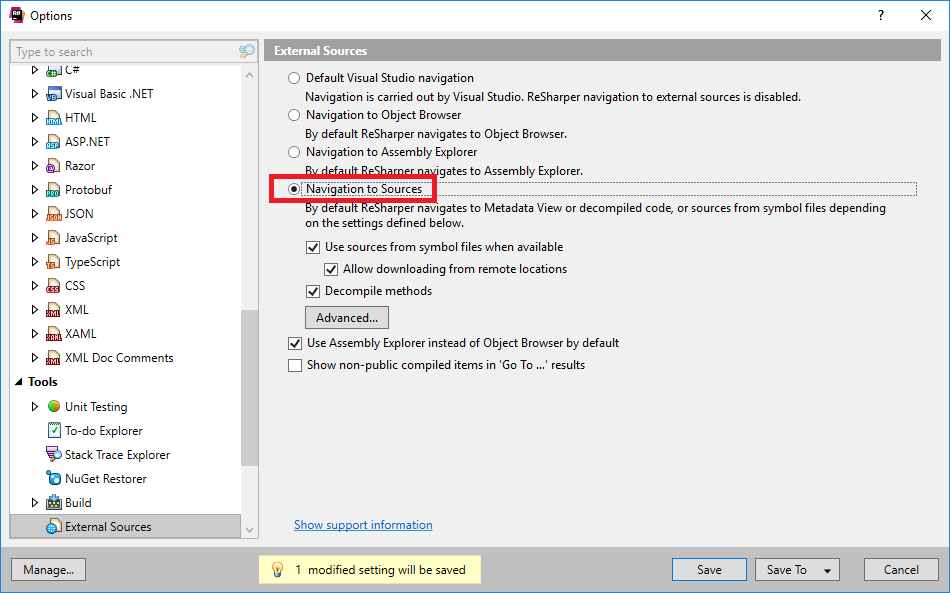
Now you can go to Unity sources and even set a breakpoint:

Looks like work is done! But…

For the second time, we see message about Symbol files. Symbol files have different formats, but we will talk about PDB format as the most recent. They are generated by default for projects that are compiled by using Visual Studio, but in our example, we only have DLL without PDB.
By default, PDB files contain the following information:
- Public symbols (typically all functions, static and global variables)
- A list of object files that are responsible for sections of code in the executable
- Frame pointer optimization information (FPO)
- Name and type information for local variables and data structures
- Source file and line number information
Without these symbol files Visual Studio cannot correlate executing instructions and existing sources codes.
Step 2
Let’s generate PDB files by existing DLL.
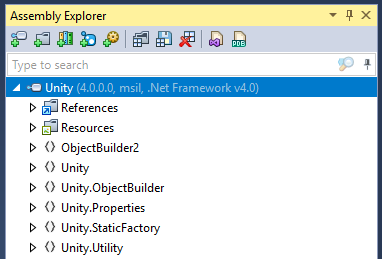
- Open Assmbly Explorer from Resharper
- Add
Unity.dll
- Generate PDB (I prefer to select symbol cache folder)
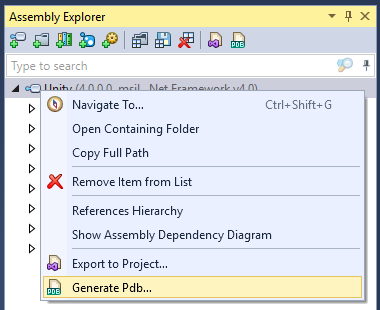
Ok, now we have symbol file for DLL.
Step 3
Configure Visual Studio to debug external sources.
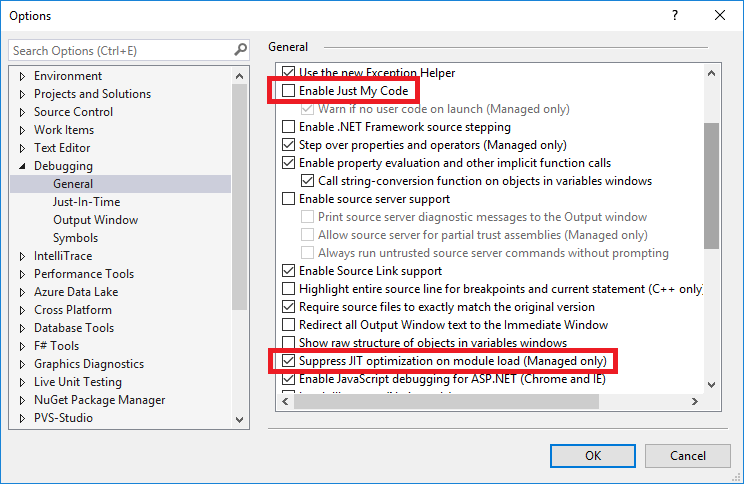
Two options:
- Disable
Enable just my codeto allow debugger to interact with external sources. - Enable
Suppress JIT optimization on module load (Managed only). It’s important options, because without it you will get unpredictable jumps through source code.
That’s all! 3 simple steps and we can debug external DLL without source codes:
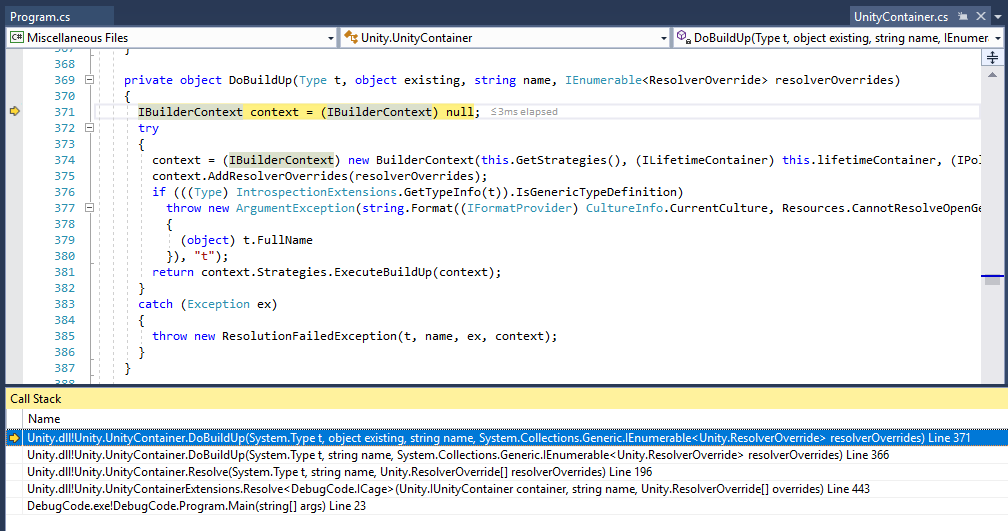
Breakpoints are working, Step into, Step over also. Full call stack.